From Stories to Stats
Using Data to Highlight Your Nonprofit’s Impact
For nonprofit organizations, storytelling is a powerful way to connect with supporters, but data is what gives your story weight. Sharing statistics, infographics, and reports can demonstrate the tangible impact of your work, inspiring trust and encouraging continued support. By leveraging data, you can show donors, volunteers, and other stakeholders that their contributions are making a real difference.
Why Data Matters
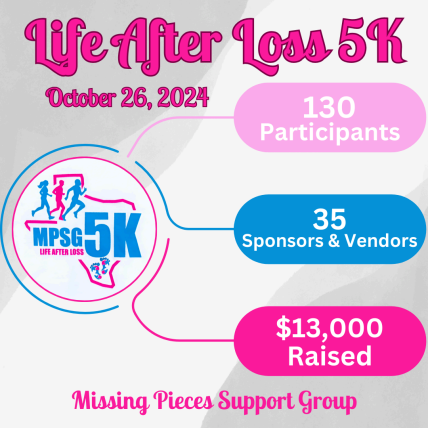
Metrics and numbers give your mission a powerful foundation. While personal stories create emotional connections, data offers the concrete proof that validates your achievements. For instance, instead of merely stating that Missing Pieces hosted a 5K to raise awareness and funds for pregnancy loss, include impactful details like the number of participants and the total funds raised. This not only strengthens your narrative but also highlights to donors how their contributions lead to tangible results.
Visualizing Data with Infographics
While raw numbers are powerful, presenting them visually can make your data even more compelling. Infographics are an excellent way to tell your story in a clear, engaging, and shareable format. They help break down complex information into digestible visuals, making it easier for supporters to understand and spread your message.
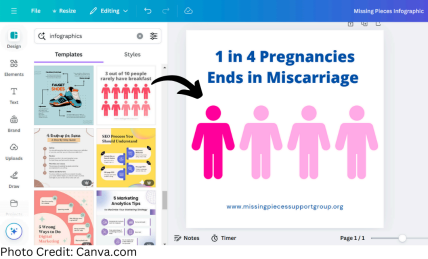
How to Create Infographics with Canva Creating infographics might sound intimidating, but tools like Canva make the process simple and accessible. Canva offers a range of customizable templates that allow you to turn your data into eye-catching visuals.
Pro Tip: Nonprofit organizations can get a free Canva account! ✨ Click the link below to learn more and start creating.
Canva for Nonprofits
Here’s how you can get started:
1. Select a Template: Canva provides infographic templates specifically designed for nonprofits. Choose one that aligns with your organization’s branding.
2. Input Your Data: Add your statistics, achievements, and key information. Be concise—focus on the highlights that tell your story effectively. 3. Add Visual Elements: Use icons, graphs, and images to complement your data. Canva’s drag-and-drop tools make it easy to adjust the design. 4. Brand Your Infographic: Incorporate your nonprofit’s colors, logo, and fonts for a polished, professional look.
5. Share Widely: Post your infographic on your website, social media platforms, and newsletters to reach your audience.
By using data to showcase your nonprofit’s impact, you not only celebrate your achievements but also strengthen your connection with your community. Pairing your data with powerful visuals like infographics ensures that your message is not only seen but remembered. Start sharing your success stories today and watch how it transforms your engagement!
How ELEVATE YOUR IMPACT Services Can Help
At ELEVATE YOUR IMPACT Digital Media Services, we specialize in helping small businesses and nonprofits harness the power of targeted email marketing to build stronger connections with their audiences. Our expert team can assist you in segmenting your email lists, crafting personalized messages that resonate with different supporter groups, and setting up regular communication schedules that keep your mission top of mind. We focus on delivering tailored strategies that drive engagement, increase donations, and strengthen volunteer relationships, all while ensuring your marketing efforts are both effective and efficient. Let us help you amplify your impact and achieve your goals through strategic email campaigns.
More Marketing Tips, Tricks & Tools